
Taxes
RetireRange estimates your income taxes inside every simulation, so the results reflect what you’d actually keep — and so you can plan around the tax decisions that matter (Roth conversions, withdrawal sequencing, when to move states). These are planning estimates, not filing-grade calculations — use them for direction, not your return.
Federal income tax
Each simulated year, RetireRange:
- adds up your taxable income — withdrawals from Traditional accounts (401(k), IRA, 403(b), 457(b)) and taxable brokerage accounts, plus Roth conversions and any pension, annuity, or rental income. The income types are not all treated alike: Roth and HSA withdrawals are tax-free and don’t count at all, and only the taxable portion of Social Security (up to 85% — see Social Security taxation below) is included. (Taxable-brokerage withdrawals are counted as ordinary income here — a simplification noted under "What the model keeps simple.")
- subtracts the standard deduction from that total, then
- applies the progressive federal brackets for your filing status — both the standard deduction and the bracket thresholds are indexed forward for inflation each year, the way the IRS adjusts them.
One consequence worth knowing. Because Roth and HSA withdrawals never enter taxable income, a plan that draws mostly from Roth shows very little taxable income — and the standard deduction can only offset income you actually have. It’s a big part of why Roth-heavy plans often pay strikingly little tax.
Both Married Filing Jointly and Single are supported. If you model the death of a spouse, the survivor is treated as Married Filing Jointly for the entire year of death (as the IRS requires) and switches to Single the following January — which usually raises the survivor’s taxes by narrowing the brackets.
Current law, projected forward — not a forecast of future tax policy. RetireRange starts from today’s brackets, rates, and deductions and indexes them forward for inflation each year. It doesn’t try to predict future legislative changes — a scheduled sunset, new rates, a rewrite of the rules — because no one knows what they’ll be. Like the Social Security projection, it answers "what does current law imply for my plan?", and we keep those current-law tables up to date as they actually change.
Where the tax comes from. Each simulated year, RetireRange draws your estimated federal + state tax bill from your portfolio at year-end — under every withdrawal target. So taxes reduce your balances and your legacy in every scenario, and any tax you save (for example by moving to a lower-tax state) flows straight through to your ending balance. There’s no special "net of tax" mode to switch on.
Social Security taxation
Up to 85% of your Social Security can be taxable depending on your total income, following the IRS formula in Publication 915. Details and thresholds are on the Social Security page.
State income tax
RetireRange models all 50 states plus the District of Columbia — including the nine with no income tax. Pick your state of residence, and RetireRange applies that state’s brackets and standard deduction, inflated forward over time, plus its rules for Social Security, retirement income, and military retired pay. You can also model a planned move to another state and see the effect; the state-move optimizer can even find the best year to move.
Every state’s figures were checked in 2026 against that state’s own revenue department or statute, and every state’s retirement and military rules are now applied — no state is left taxing that income in full by default. Several were found out of date and corrected, in both directions: most states got cheaper in the model, and a few (Oregon and California among them) got more expensive. If you compared states or saved move results before mid-October 2026, run them again.
How current is the state data? Each state is reviewed once a year against its own forms, instructions or statute, and every change is a sourced edit checked by a person — state tax data is never updated automatically. Where a state has already enacted a change for a future year, RetireRange records it but doesn’t apply it early. Seven states have such changes on the books (Georgia, Hawaii, Indiana, Mississippi, Nebraska, New York and Virginia), and every one of them makes the state cheaper — so plans there show slightly more state tax than they eventually will, which is the cautious direction.
Social Security
Most states don’t tax Social Security at all. Montana taxes it the way the federal return does. Seven states tax it only above an income limit or below an age, and RetireRange applies each test (income here means your federal adjusted gross income):
| State | When Social Security is exempt |
|---|---|
| Colorado | Always from age 65; under 65, when income is at or below $75,000 single / $95,000 joint |
| Connecticut | When income is under $75,000 single / $100,000 joint; above that, at most 25% of benefits is taxable |
| Minnesota | When income is at or below $84,490 single / $108,320 joint |
| New Mexico | When income is at or below $100,000 single / $150,000 joint |
| Rhode Island | From age 67, when income is at or below $107,000 single / $133,750 joint |
| Utah | A tax credit that shrinks as income rises above $54,000 single / $90,000 joint |
| Vermont | When income is at or below $55,000 single / $70,000 joint, phasing out over the next $10,000 |
Where a state does tax it, only the federally taxable portion of your benefit counts (not the gross).
Retirement income — pensions, annuities, and account withdrawals
Many states exclude some or all retirement income. For RetireRange, retirement income means pension and annuity income, withdrawals and RMDs from Traditional 401(k), IRA, 403(b) and 457(b) accounts, and Roth conversions. Brokerage-account gains, and Roth, HSA and VEBA withdrawals, aren’t part of it.
These are the states where RetireRange applies the state’s own rule. Amounts are per person unless the row says per return:
| State | What’s excluded |
|---|---|
| Alabama | Pensions in full, at any age; other retirement income up to $6,000 from age 65 |
| Arizona | Federal and Arizona public pensions, up to $2,500 combined; nothing for private pensions or another state’s public pension |
| Arkansas | $6,000 from age 59½ |
| Colorado | $20,000 from age 55; $24,000 from 65. Social Security counts toward it (see below) |
| Connecticut | All of it when income is under $75,000 single / $100,000 joint, phasing out to nothing at $100,000 / $150,000 |
| Delaware | $2,000 under age 60 ($12,500 for military retired pay); $12,500 from 60 |
| Georgia | $35,000 from age 62; $65,000 from 65. Military retired pay: up to $17,500 under 62 |
| Hawaii | Employer pensions in full; IRA and 401(k) withdrawals and annuities are taxed |
| Idaho | Federal civil service (CSRS) annuities only, from age 65, and military retired pay from 62: one deduction per return shared between them, $48,216 single / $72,324 joint, reduced by the Social Security you receive. FERS annuities and private pensions are taxed |
| Illinois | All of it, from age 59½ |
| Indiana | Federal civil service annuities only: $16,000 from age 62, reduced by your Social Security. Private pensions, 401(k)s, IRAs and Indiana state or local pensions are taxed |
| Iowa | All of it, from age 55 — IRAs, 401(k)s, pensions and Roth conversions included; an annuity bought with after-tax money doesn’t qualify |
| Kansas | Federal pensions and Kansas public pensions (such as KPERS) in full; nothing for private pensions or another state’s public pension |
| Kentucky | $31,110, at any age |
| Louisiana | Federal pensions (military and civilian) and Louisiana public pensions in full, at any age; plus $12,000 of other retirement income from age 65 |
| Maine | $48,216, reduced by all the Social Security you receive, then phased out above $125,000 single / $250,000 joint of income (gone at $225,000 / $350,000); Roth conversions don’t qualify |
| Maryland | $41,200 from age 65, reduced by your Social Security; IRA withdrawals don’t qualify |
| Massachusetts | Federal and Massachusetts public pensions in full; nothing for private pensions or another state’s public pension |
| Michigan | $65,897 single / $131,794 joint per return, from age 59½ |
| Minnesota | CSRS annuities only: up to $13,540 single / $27,080 joint per return, at any age, cut in steps above $84,490 single / $108,320 joint of income (see below). FERS annuities, private pensions and Minnesota’s own public pensions are taxed |
| Mississippi | All of it, from age 59½ |
| Missouri | Public pensions from any government: up to $47,633, reduced by your taxable Social Security, no income limit. Private pensions, 401(k)s and IRAs: $6,000 at any age, reduced dollar for dollar above $25,000 single / $32,000 joint of income |
| Nebraska | CSRS annuities only, in full: no cap, age limit or income test. FERS annuities and private pensions are taxed |
| New Jersey | From age 62: up to $75,000 single / $100,000 joint per return when income is $100,000 or less; a partial share (37.5% single / 50% joint, then 18.75% / 25%) up to $150,000; nothing above that |
| New York | $20,000 from age 59½ |
| Oklahoma | $10,000, at any age |
| Pennsylvania | All of it, from age 59½ |
| Rhode Island | $50,000 from age 67, when income is at or below $107,000 single / $133,500 joint |
| South Carolina | $3,000 under age 65; $15,000 from 65 |
| Vermont | CSRS annuities only: the first $10,000 per return, at any age, in full below $55,000 single / $70,000 joint of income and phasing out to nothing at $65,000 / $80,000. Vermont makes you choose between this and its Social Security exclusion (see below). FERS annuities and private pensions are taxed |
| Virginia | $12,000 from age 65, reduced dollar for dollar above $50,000 single / $75,000 joint of income |
| Wisconsin | $24,000 from age 67 |
Taxed in full: California, the District of Columbia, Montana, New Mexico, North Carolina, North Dakota, Ohio, Oregon, Utah and West Virginia have no general exclusion for pension, 401(k) or IRA income, and RetireRange taxes it in full there. That’s because the state does, not because the rule is missing. Idaho, Minnesota, Nebraska and Vermont are the same except for CSRS annuities (see the table). Military pay is often treated differently; see below. Montana repealed its pension exemption from the 2024 tax year, so any source still describing one is out of date.
Allowances at 65 that cover any income. Three states give people 65 and over an allowance against any income, wages and interest included, not just retirement income. RetireRange applies all three, per person:
- Montana: $5,660, with no income test.
- New Mexico: up to $8,000, stepping down as income rises and gone above $28,500 single / $51,000 joint.
- West Virginia: $8,000, reduced by the Social Security West Virginia already exempts. The two compete rather than add up, so a large benefit leaves little or none of it.
Exclusions that shrink, or compete, in ways you might not expect:
- Colorado. Social Security counts as qualifying income for the $20,000 / $24,000 subtraction. From 65, or from 55 with income at or below $75,000 single / $95,000 joint, Colorado subtracts all your taxable Social Security directly, and that subtraction comes off the pension cap, dollar for dollar. So a retiree already subtracting their whole benefit may have little or none of the pension subtraction left. At 55–64 above that income limit, there’s no direct Social Security subtraction, but your benefit fills whatever part of the $20,000 your pension doesn’t. A $12,000 pension plus Social Security can use the full $20,000.
- Maine. The $48,216 is first cut by all the Social Security you receive, taxable or not, and then whatever is left phases out at higher incomes. IRAs, Roth IRAs, SEP, SIMPLE and 457(b) plans all qualify alongside pensions and 401(k)s, but a Roth conversion doesn’t. Maine says you don’t receive a retirement benefit when you convert, so converting neither uses up the deduction nor benefits from it.
- Minnesota. The CSRS subtraction shrinks in steps, not along a line. Above $84,490 single / $108,320 joint of income, each further $2,000 (or part of it) cancels another 10%. So one extra dollar of income can cost a tenth of the subtraction, and it’s gone by about $103,500 / $127,300.
- Missouri. The public and private breaks work very differently. A public pension keeps its large exemption at any income, while the private $6,000 disappears a little above $25,000 / $32,000 of income. Neither has an age test.
- Vermont. Vermont lets you claim only one of its exclusions for Social Security, CSRS annuities and other non-Social-Security public pensions in a year. RetireRange works out both and keeps whichever saves more, which is what you’d elect. So a Vermont household with a sizeable Social Security benefit may see no change from marking an annuity CSRS, because the Social Security exclusion was already worth more. That’s correct, not the setting failing. Vermont’s military exclusion sits outside that choice and is added on top.
Smaller breaks RetireRange doesn’t apply. Several states have narrower relief the model leaves out. Each one makes the plan show slightly more state tax than you’d owe, never less:
- Utah’s $450 retirement credit. It’s only for people born in 1952 or earlier, a fixed group the model can’t express, and Utah doesn’t let you combine it with the Social Security credit RetireRange already applies.
- Ohio’s retirement income credit (at most $200)
- Oregon’s retirement income credit, which most retirees with ordinary Social Security don’t qualify for, and its pro-rated exemption for federal service before October 1991
- Idaho’s deduction for PERSI Firefighters Retirement Fund benefits and closed Idaho city police funds
- Minnesota’s subtraction for its own public pensions whose members never paid into Social Security (such as PERA Police and Fire), and Vermont’s $10,000 for other public pensions not covered by Social Security. RetireRange can tell CSRS from FERS, but not which other plans were outside Social Security.
- New Mexico’s exemption for a blind filer under 65
One leans the other way: Louisiana exempts its own public pensions from a named list of systems, and RetireRange can’t tell which plan you’re in, so an unusual Louisiana public plan that isn’t on the list would be exempted when Louisiana taxes it.
Military retired pay
Mark a pension as Military retirement pay on the Household tab and it gets its state’s military rule instead. It has no effect on federal tax.
- Exempt in full: Alabama, Arizona, Arkansas, Connecticut, Hawaii, Illinois, Indiana, Iowa, Kansas, Louisiana, Maine, Massachusetts, Michigan, Minnesota, Mississippi, Missouri, Nebraska, New Jersey, New York, North Carolina, North Dakota, Ohio, Oklahoma, Pennsylvania, Rhode Island, South Carolina, West Virginia and Wisconsin. In most of these there’s no cap, age limit or income test, and a military exemption is separate from the state’s general retirement break — Rhode Island’s, for example, has none of the limits its $50,000 pension exclusion carries.
- Capped: Virginia ($40,000 per person); Maryland ($12,500 per person under 55, $20,000 from 55); New Mexico ($30,000 per person — up from $20,000, and now permanent and extended to surviving spouses); Idaho (from age 62, $48,216 single / $72,324 joint, reduced by your Social Security, and one deduction per return, shared with any CSRS annuity, not one each); Vermont (in full below $125,000 of income, phasing out to nothing at $175,000).
- A credit instead of an exclusion: Utah relieves military pay in full through a credit. It’s nonrefundable, so it can take your Utah bill to zero but never below it.
- Shares the general retirement exclusion: Colorado (from age 55), Delaware, Georgia and Kentucky exempt military pay through the same allowance as other retirement income, so the amounts in the table above cover both together. A Colorado military retiree aged 55 or over gets one $20,000 / $24,000 subtraction covering everything. Two give military retirees more at younger ages. In Delaware, a military retiree under 60 can exclude up to $12,500 (one $12,500 in total) instead of the general $2,000. In Georgia, a military retiree under 62 can exclude up to $17,500 per qualifying spouse, before the general exclusion starts. From 60 in Delaware and 62 in Georgia, the ordinary rules apply.
- Taxed: California, the District of Columbia, Montana and Oregon.
A few details worth knowing:
- Oregon taxes military retirement pay like any other pension. RetireRange previously exempted it, so a plan for an Oregon military retiree now shows more state tax than before.
- Montana’s military exemption looks generous on paper but reaches few retirees: it’s only for people who became residents after June 2023, and it’s capped at your Montana wages or business income — so a retiree with no earned income gets nothing. RetireRange applies none of it.
- Colorado has a separate $15,000 military subtraction under age 55 that RetireRange doesn’t apply, on purpose. It exists only for tax years 2022–2028, and the model applies today’s rules to every plan year, so modeling it would wrongly carry it on past 2028. An under-55 Colorado military retiree sees slightly more tax than owed for 2026–2028.
- Idaho also allows its deductions to a disabled retiree below the age floor, and its civil-service deduction to someone under 62 who is still working. RetireRange sees only age, so it doesn’t model those routes. Idaho also reduces the maximum by railroad retirement benefits, which RetireRange has no field for; that’s the one Idaho gap that makes the plan show less tax than owed.
- Georgia gives a military retiree with Georgia earned income above $17,500 a second $17,500, and in Delaware a military retiree’s other pension income under 60 is still held to $2,000. RetireRange applies neither extra, so both show slightly more tax than owed.
- North Dakota doesn’t extend its exemption to retirement pay earned as a dual-status military technician under federal civil service. If that’s your pension, don’t mark it as military pay.
- Indiana doesn’t exempt the share a divorced spouse receives under a decree.
Government pensions
Arizona, Indiana, Kansas, Louisiana, Massachusetts and Missouri treat a public pension differently from a private one, and they care which government pays it — Indiana’s break is for federal civil service only, Louisiana’s for federal and Louisiana pensions, and Missouri’s for any government, another state’s included. On the Household tab, each pension has a Government pension setting — No — private employer, Federal government, or State or local government — and for a state or local pension, Paid by which state. That’s the state that pays the pension, which isn’t always where you live now. In other states the setting has no effect.
Federal civil service: CSRS or FERS. Idaho, Minnesota, Nebraska and Vermont exempt annuities from the older Civil Service Retirement System (CSRS) but tax those from the Federal Employees Retirement System (FERS), which covers nearly everyone hired since 1984. So a pension set to Federal government also gets a Federal retirement plan setting: Not sure (the default), CSRS or FERS.
- Leaving it on Not sure applies no exclusion, on purpose, because leaving a field blank should never earn a tax break. If you’re a CSRS annuitant in one of those four states, set it to see the exclusion. A plan in one of those states with Not sure shows an amber reminder on the field.
- How to tell which you have: check the first digit of the account number on your CSA-1099. 0–4 means CSRS, and 7 or 9 means FERS.
- A first digit of 8 means OPM pays part from each system. Your Notice of Annuity Adjustment shows the split. Enter the annuity as two pensions, one marked CSRS and one FERS, and only the CSRS part is exempted.
What the state side keeps simple
- Who owns the income matters. Exclusions are applied per person, using each person’s own age and their own pensions, annuities and account withdrawals. So a 70-and-55 couple in Pennsylvania gets the 70-year-old’s pension excluded now, while the younger spouse’s waits until 59½. A per-person cap covers only that person’s own income and can’t be lent to a spouse. In New York, a couple where one spouse has $80,000 of retirement income and the other $5,000 excludes $25,000, not $40,000. That’s what New York says, and it means a lopsided household pays more state tax than it would if the cap were pooled. So enter each pension and annuity under the person who receives it on the Household tab, and set each account’s Owner on the Accounts tab. Income RetireRange can’t attribute to one person is treated as the youngest person’s.
- Five states set one cap for the whole return: Idaho, Michigan, Minnesota, New Jersey and Vermont. In New Jersey and Michigan, only the qualifying spouse’s income counts toward it. Idaho, Minnesota and Vermont still use the youngest person’s age for their age tests.
- Social Security offsets are split by each person’s share of the benefit. Where a state reduces each person’s cap by their own Social Security (Maine, Maryland, Missouri), RetireRange divides the household’s benefit between you in proportion to what each of you receives.
- Exclusion amounts and income limits stay at today’s figures rather than rising with inflation, so later years in a long plan run a little high.
- County and local taxes aren’t included (Maryland’s state figures do include a county add-on), and neither is New York City’s income tax.
- New York recaptures the benefit of its lower brackets from higher-income households, starting above $107,650 of income. RetireRange doesn’t, so a high-income New York plan understates state tax.
Financial planners: the model limitations page lists the remaining state-by-state simplifications and which way each one leans.
Relocating to Puerto Rico or abroad
RetireRange models U.S. federal tax plus the 50 states and D.C. It does not model Puerto Rico (or the other U.S. territories) or living outside the country — federal tax is always computed from the U.S. brackets, and there’s no override to reduce it. If either applies to you, treat RetireRange’s tax figures as an upper-bound U.S.-resident estimate and take the specifics to a cross-border tax professional. A few things worth knowing so you don’t over- or under-estimate the benefit:
-
Puerto Rico. A bona fide PR resident can exclude Puerto Rico–source income from U.S. federal tax under IRC §933, paying PR’s own tax instead. The catch for retirees: the exclusion follows the source of the income, and a distribution from a Traditional IRA, 401(k), or pension you earned on the mainland is generally still U.S.-source — and still federally taxable even after you move. The large PR tax advantages mostly apply to income earned while you’re a resident there (wages, and post-move investment gains under PR’s incentive programs), not to drawing down accounts you built during a mainland career. Bona fide residency is a real test (days present, tax home, closer connection), and for anyone whose pay is tied to where the work is physically performed — pilots and other mobile professionals — establishing that the income is PR-source is its own hurdle. This is squarely a "confirm it with PR tax counsel" situation.
-
Living abroad. The U.S. taxes citizens on worldwide income regardless of where they live, so moving overseas does not switch off U.S. federal tax. The Foreign Earned Income Exclusion can shelter a capped amount of earned income (wages/self-employment) — but not pensions, IRA/401(k) distributions, Social Security, or investment income, which is most of a retiree’s income. A foreign tax credit and any applicable tax treaty keep you from being taxed twice, but rarely drop your total below the U.S. level. Whether your former state still taxes you depends on how cleanly you ended your domicile there.
The takeaway: for someone still earning in PR or abroad, the tax picture can differ a lot from what RetireRange shows; for someone drawing down an already-built portfolio, the difference is usually much smaller than expected — because the income these regimes shelter isn’t the income a retiree lives on. Model your plan as a U.S. resident for a conservative baseline, and get a professional to quantify the actual difference.
IRMAA — the Medicare income surcharge
Once you’re on Medicare, a high income in the prior year can trigger IRMAA — an Income-Related Monthly Adjustment Amount added to your Part B and Part D premiums. It’s tiered (the more income, the bigger the surcharge), assessed per person, with the income thresholds and surcharge amounts rising with inflation each year, and RetireRange calculates it automatically.
The practical takeaway: a big one-off income event — a large RMD, a Roth conversion, a property sale — can quietly raise your Medicare premiums two years later. RetireRange surfaces this so you can plan conversions and withdrawals with the IRMAA thresholds in mind.
What the model keeps simple
Here’s where the tax modeling is deliberately approximate — and note that most of these lean conservative (they tend to overstate your tax):
- Taxable-account withdrawals are treated as 100% ordinary income. Real long-term capital gains get preferential rates, so this overstates the tax on those accounts.
- Roth withdrawals are treated as income-tax-free and the 5-year rule isn’t enforced, so very new Roth accounts may be treated more favorably than reality. The exception is a pre-retirement withdrawal before 59½, which is taxed and penalized (see below).
- Not modeled at all: capital-gains rates, qualified-dividend treatment, the Alternative Minimum Tax (AMT), the Net Investment Income Tax, Qualified Charitable Distributions, tax-loss harvesting, and estate tax.
See Limitations for the full list.
The 10% early-withdrawal penalty
Taking money out of a retirement account before 59½ normally costs a 10% penalty on top of the income tax. RetireRange handles this only where it can arise: on the Pre-Retirement Withdrawals card on the Strategy tab.
Each pre-retirement draw gets a penalty determination from your age at the withdrawal date, the account’s tax type, and any §72(t) exception you select — with the exception list filtered to those your account qualifies for (first home, higher education, and unemployed health premiums are IRA-only; medical over 7.5% of AGI, disability, birth or adoption, the SECURE 2.0 emergency withdrawal, and federal disaster apply to both IRAs and employer plans). Rule of 55 and a Roth-basis assertion are available where they apply, and you can override the determination either way.
Two things worth knowing about how this interacts with the rest of the tax model:
- The penalty is paid from the account. The 10% penalty is drawn from the account along with the withdrawal. In Net entry mode ("cash needed"), the gross withdrawal is recalculated on every run from the account’s current tax type and the owner’s current birth date. The optional marginal-rate field on the card is display-only; it feeds a net-cash-in-hand line and nothing else.
- A Traditional-account draw is ordinary income in its year and runs through the tax engine above, so it counts toward brackets, IRMAA and Social Security taxation. So is a Roth draw before 59½, which RetireRange treats as earnings: the whole amount is taxable unless you tick Roth basis on a Roth IRA. A §72(t) exception or the Rule of 55 removes the penalty, not the tax. Early distributions now cost more in the forecast than in earlier versions. The card’s rationale line remains a sizing aid, not a tax calculation.
Taxes your heirs pay (after-tax legacy)
The after-tax legacy figure goes a step beyond your own taxes: it estimates what your heirs keep after the tax due on what they inherit, by account type. Inherited Traditional and HSA balances are taxed at your heirs’ ordinary income rate (plus an optional state rate); Roth, Taxable, and VEBA pass at full value — Roth tax-free, and the taxable account via a step-up in basis (an heir who sells right after inheriting owes no capital-gains tax on the growth during your lifetime). You set those rates on the Heir Tax Treatment card of the Assumptions tab. This is why a Roth-heavy plan often leaves more after-tax legacy than a Traditional-heavy one with the same headline balance.
One thing to know about how that heir tax is applied: the model taxes the entire inherited Traditional (or HSA) balance at once, at the rate you set — it doesn’t simulate heirs spreading those withdrawals across the SECURE Act’s 10-year window to fill up the lower brackets first. So if you set a high heir rate, the figure can overstate what your heirs actually pay. That’s deliberate — the conservative direction — but read it as a ceiling, not a precise bill. (Inherited taxable assets, by contrast, are assumed sold at the stepped-up basis with no later capital-gains drag.) See Limitations.
Using the tax numbers
The tax summary chart and the lifetime-tax figures are best used to:
- gauge roughly how much of your withdrawals taxes will absorb,
- compare strategies that differ in their pre-tax vs. Roth vs. taxable mix, and
- spot years with spikes (big RMDs, conversions, lump sums) that push you into higher brackets or IRMAA tiers.
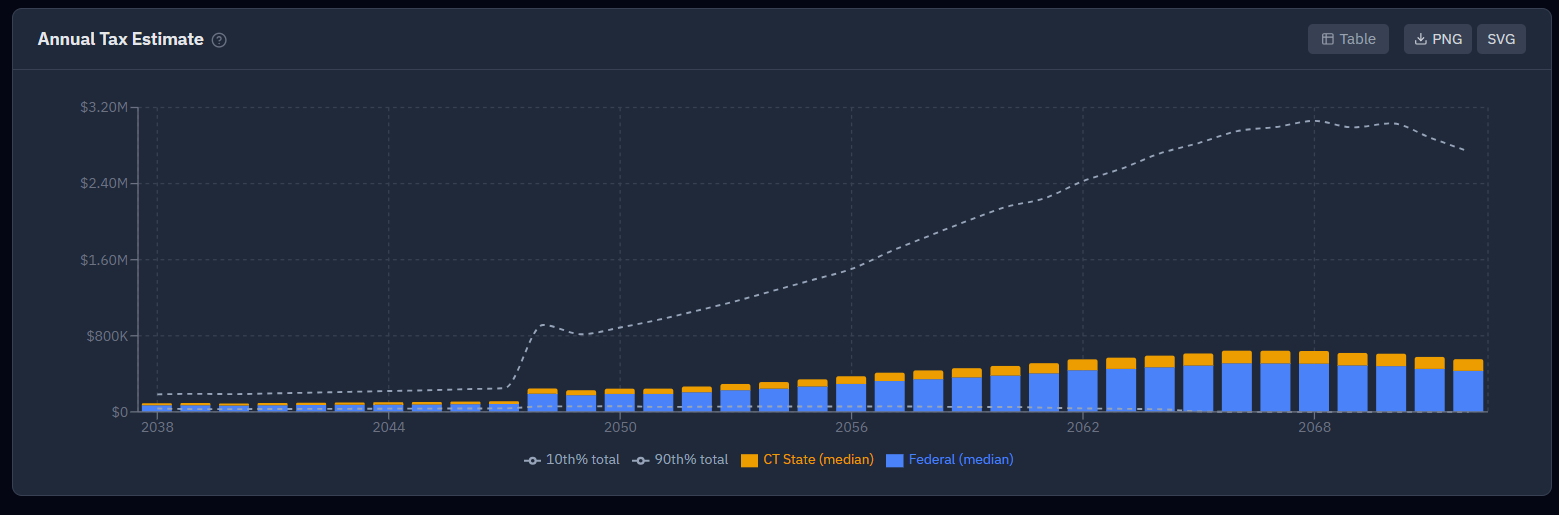
The chart’s state line is the state tax the plan actually paid, exemptions included. It’s the same figure as the Year-by-Year State tax column, the What-If panel’s lifetime state tax and the AI summary. Before October 2026 those views ignored state retirement and military exemptions and could show tens of thousands of dollars of lifetime state tax the plan never paid. The federal line is still estimated from median taxable income.
Lifetime Taxes Paid counts the federal plus state income tax assessed each year (including any early-distribution penalty), so it is comparable to a real tax bill. Earlier screenshots or exports showed an inflated figure.
Don’t optimize to minimize "Lifetime Taxes Paid" on its own. At high withdrawal rates, lifetime taxes can fall simply because the portfolio depletes faster — fewer dollars left to tax — so a "low-tax" plan can actually be a failing one. Always find the high-success-rate plans first, then compare taxes within that group. See Understanding your results.
Related: Roth conversions · RMDs
RetireRange is for educational and planning purposes only and is not financial, tax, or investment advice. Tax figures are modeled estimates based on current law and the assumptions you provide — not tax advice and not suitable for filing. Consult a qualified tax professional or financial planner for advice specific to your situation. See Limitations.