
How It Works
Most retirement tools ask for a few numbers and hand back one answer. RetireRange works differently, and this page walks you through exactly how — first the flow you’ll actually use, then what the engine is doing behind it. No black box.
Part 1 — The walkthrough
It’s a loop, not a form you fill out once.
You build a plan, run it, change one thing, run it again. The value isn’t in reaching the end — it’s in how easily you can ask the next question.
Step 1 — Describe your household
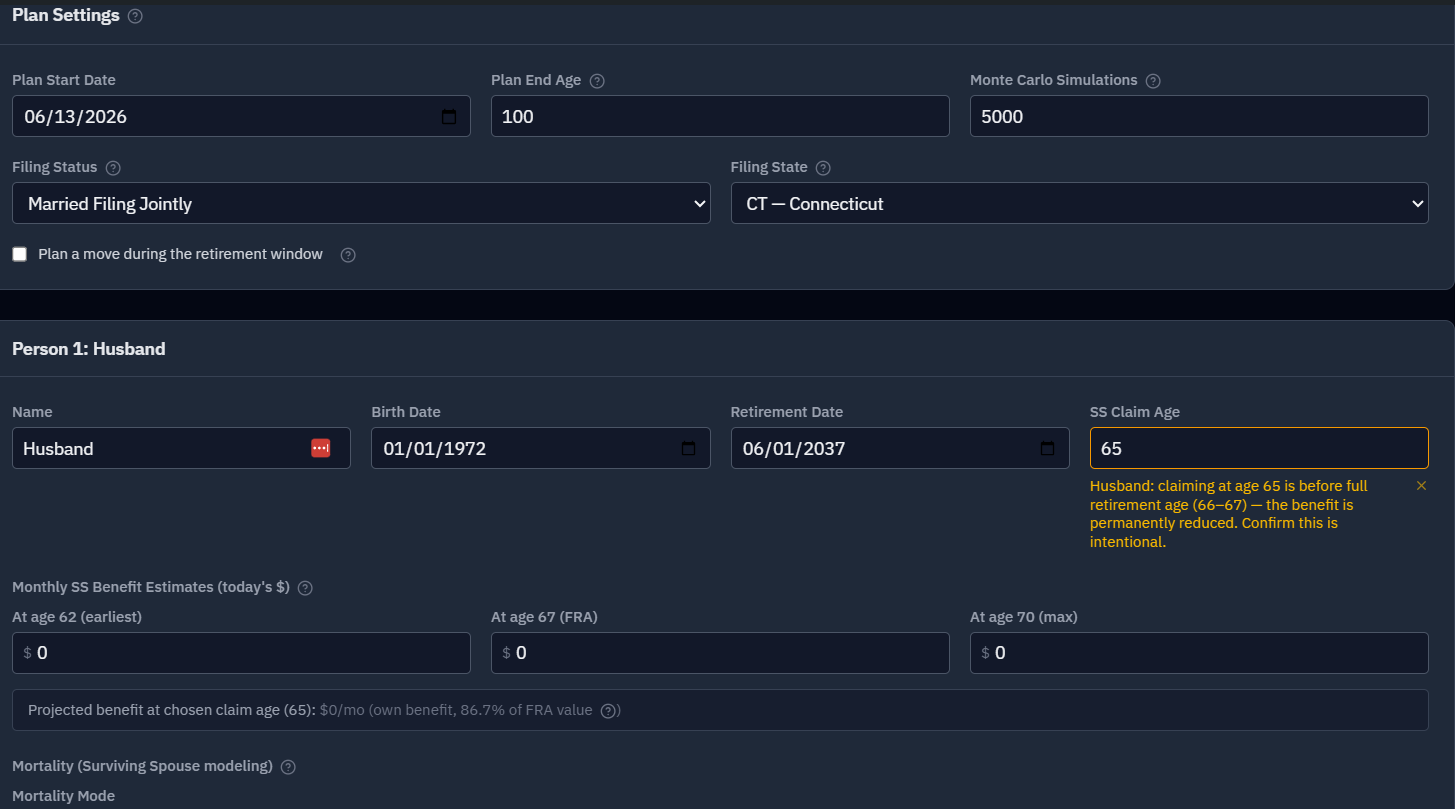
Start with the people. Birth dates, target retirement dates, and your Social Security benefit estimates from your SSA statement (the amounts at 62, full retirement age, and 70 — RetireRange fills in every age between). If you’re planning as a couple, you enter both, and you can model mortality — including what happens financially when one spouse outlives the other.
Every field has a sensible default or a clear prompt. You can start rough and sharpen later.
Step 2 — Add your accounts
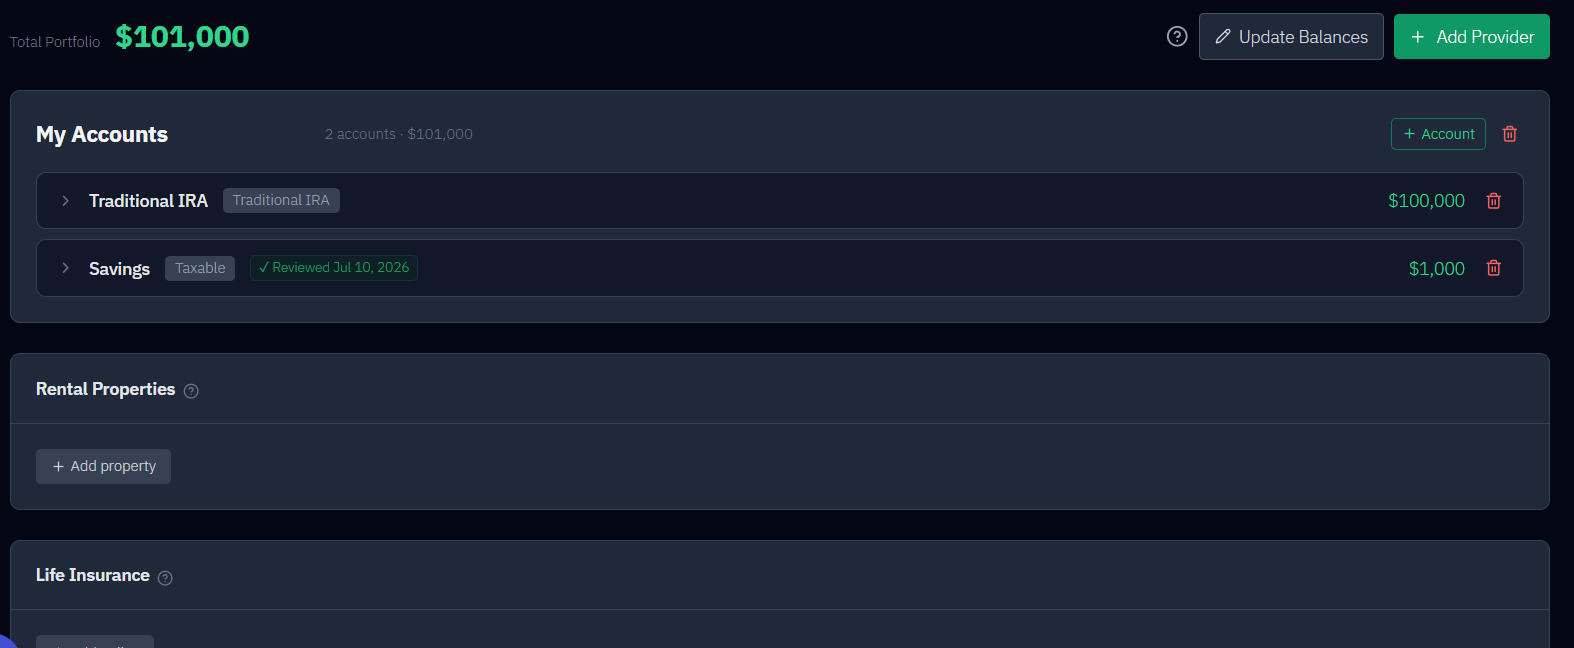
Enter your accounts the way you actually hold them — Traditional and Roth, taxable brokerage, HSA, VEBA, cash — with their balances and any ongoing contributions. RetireRange keeps the tax character of each account straight, because which account a dollar comes out of changes how much of it you keep.
There’s nothing to connect and nothing to link. You type what you want the model to know; it pulls nothing automatically.
Step 3 — Set your assumptions
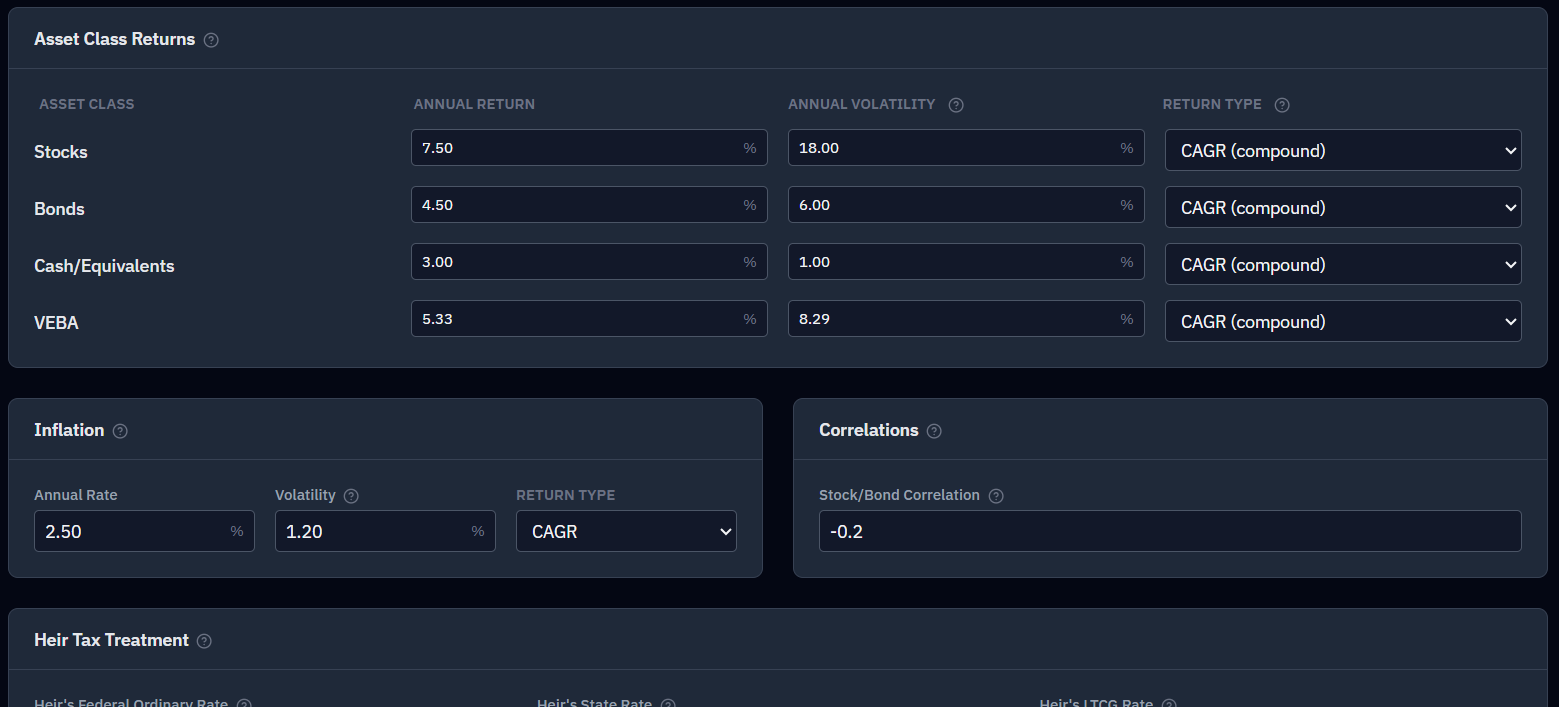
This is where a lot of tools hide the math. RetireRange puts it in front of you: expected returns and volatility for stocks, bonds, and cash; inflation; and how you want taxes on an inheritance handled. Use the built-in defaults to start fast — they’re documented and conservative — or take control of every number. Nothing is assumed silently.
Step 4 — Choose your strategy
Now the decisions that actually shape a retirement:
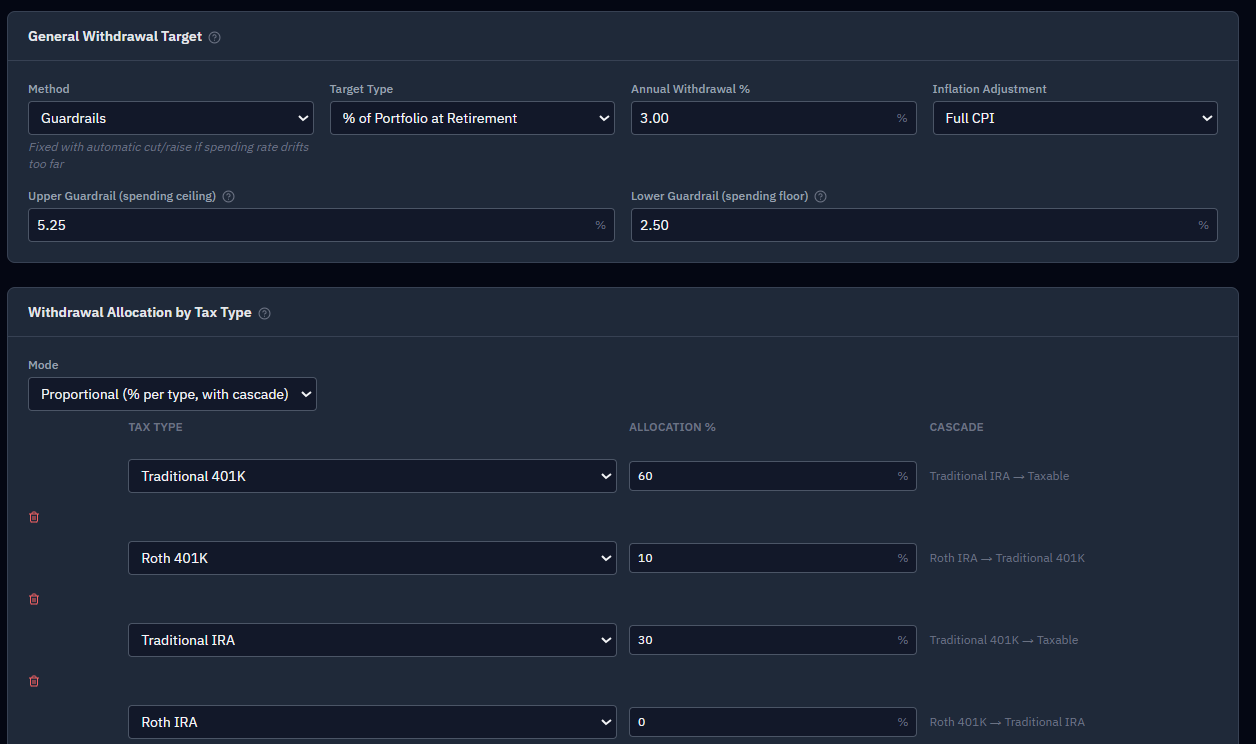
- How you withdraw — a steady inflation-adjusted paycheck, spending that flexes with the market, or guardrails that trim and raise spending automatically as your withdrawal rate drifts.
- When you claim Social Security, and in what order you draw down your accounts.
- The extras that matter — Roth conversions, the health-insurance bridge before Medicare, spending that changes across the go-go / slow-go / no-go years, one-off inflows and outflows.
Name this whole setup — "Claim at 67, convert to Roth through 72" — and it becomes a saved strategy you can compare against later.
Step 5 — Run it, and read the range
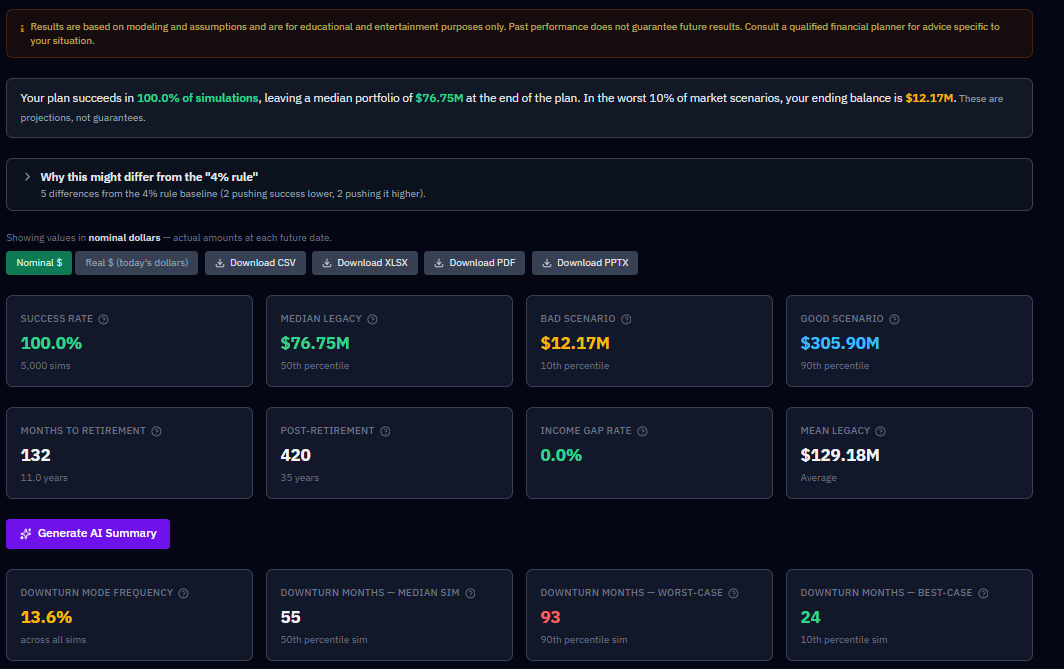
Press run and RetireRange plays your plan forward through thousands of different market futures (5,000 by default). What comes back isn’t a single number — it’s a picture:
- A success rate: the share of those futures in which your money lasted.
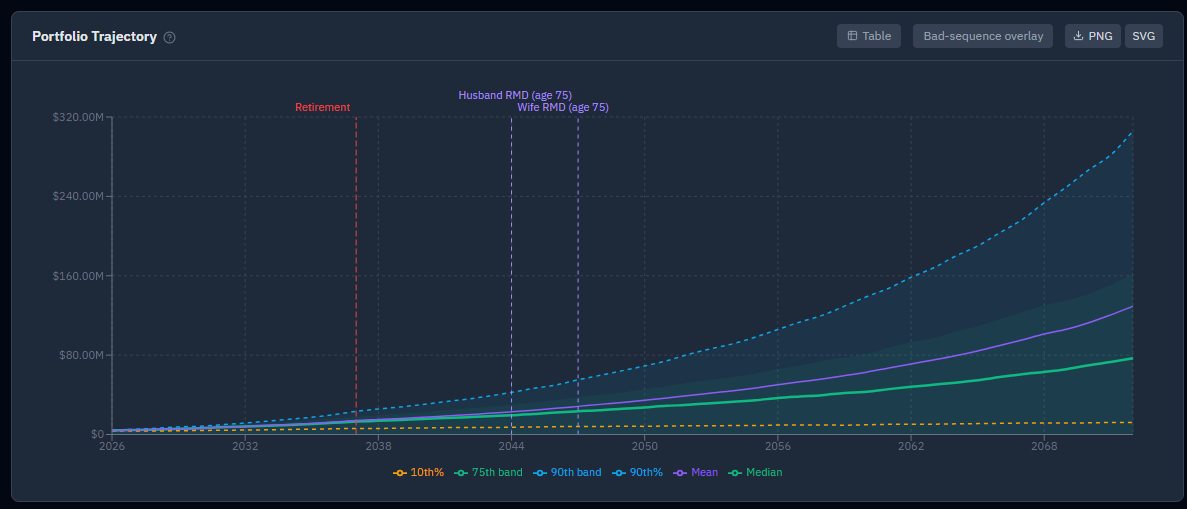
- A range of outcomes, shown as percentile bands over time — the bad-luck path, the middle, the good-luck path, all at once.
- The detail underneath — income, taxes, RMDs, when plans tend to fail, and what your heirs actually keep after tax.
And with one click, a plain-language read on all of it — where your plan looks strong, where the real risks sit, and which decisions are worth your attention next. Written by Anthropic’s Claude, it turns a screen of percentiles into a clear sense of what to do with what you’re seeing: which lever to test, which assumption to stress, which question to bring to your advisor.
Step 6 — Change one thing. Run it again.
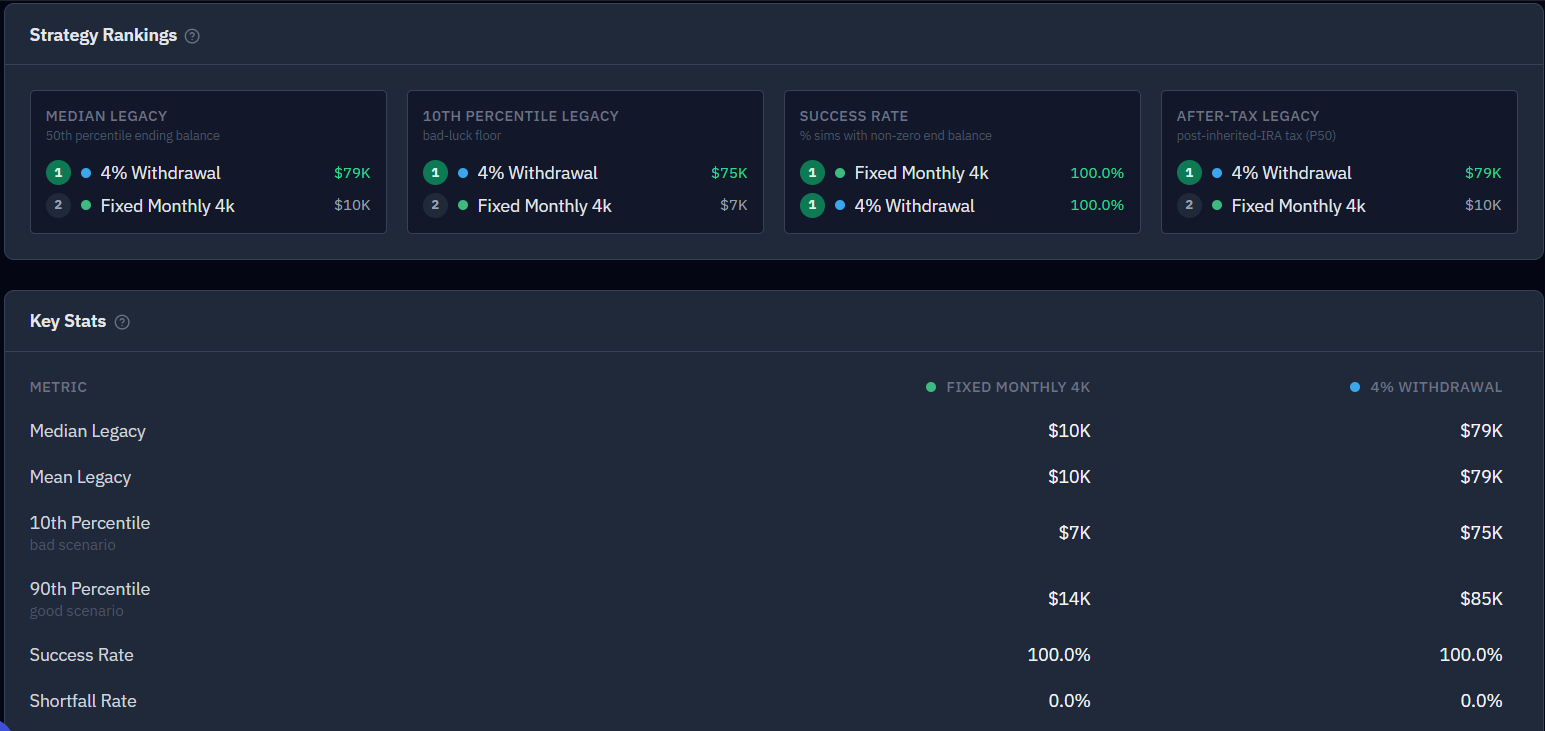
This is the part a one-number calculator can’t give you. Shift a claiming age. Retire a year earlier. Assume returns disappoint. Watch your odds move. Save each version so nothing gets lost — then put your finalists head-to-head against the same market futures, so the difference you see is the strategy, not luck.
If you’re not sure what to change first, the sensitivity analysis ranks every assumption and decision by how much it actually moves your outcome — so you spend your time on the levers that matter, not the ones that merely feel important. From there the what-if guides walk through the common questions one at a time: retire early, spend more, claim Social Security at 62, live to 100. And when you just want a rough answer without a full run, the Quick Calculator updates as you drag a slider.
When you’d rather not test values by hand at all, hand the decision to the optimizer — a claiming age, a withdrawal rate, even when to move states — and it searches the whole range for the value that maxes out your success rate.
That’s the loop. Steps 5 and 6 are yours to run as many times as you want.
Part 2 — What’s happening under the hood
Why thousands of futures instead of one
The single number a basic calculator gives you quietly assumes the future is knowable — a steady average return, every year, on schedule. Real markets don’t work that way, and the order returns arrive in matters as much as their average. A crash in your first few retirement years does damage that the exact same crash twenty years later never would, because you’re selling into it. That’s sequence-of-returns risk, and it’s the whole reason Monte Carlo simulation exists.
So instead of one tidy projection, RetireRange generates thousands of month-by-month sequences of returns and inflation — each a different plausible history — and runs your entire plan through every one. The spread you see is the answer: not a promise, a range of what could happen and how often.
The futures aren’t random noise
The returns aren’t independent coin flips. Stocks, bonds, cash, and inflation are drawn together, using their real-world relationships — when stocks fall, bonds and inflation behave the way they actually tend to, not in isolation. That’s what makes the modeled bad years look like real bad years instead of statistically impossible ones.
Why the comparison is fair
When you compare two strategies, RetireRange runs them against the same set of market futures. Both plans face the identical crash in the identical year. So when one comes out ahead, you’re seeing the quality of the strategy — not the luck of the draw. Most tools can’t isolate that, and it’s the single most useful thing RetireRange does.
It’s a model, and it says so
RetireRange is rigorous, but it’s still a model — and a model is a set of judgment calls, not a prediction. It’s openly documented about the simplifications it makes and the things it deliberately leaves out. That honesty is the point: you can see exactly how the machine works, hand the methodology to your financial planner, and decide for yourself how much to trust each result. A range you understand beats a number you don’t.
For what the model deliberately doesn’t do, see Limitations. And inside the app there’s a full Planner’s Guide — every assumption and simplification written out — designed to be handed to a financial planner so they can check the work themselves.
The best way to understand it is to run it
Your first simulation takes a few minutes and a few numbers you already have. See your retirement as a range.