
Historical Backtest
Monte Carlo asks "how does my plan hold up across thousands of possible futures?" The Historical Backtest asks a different, complementary question: "How would my plan have held up in the markets that actually happened?" It replays your exact strategy against real history.
What it does
For every start year from 1928 to 2025 — 98 in all — RetireRange runs one path through your plan using the actual historical returns for that sequence of years: real S&P 500 stocks, 10-year Treasuries, T-bills, and CPI inflation. Your current accounts, contributions, withdrawals, and household settings are applied to each.
So it answers: if you’d retired into 1973, or 2000, or 1995, with this exact plan — what would have happened?
How to read the results
- Historical success rate — the share of those 98 start years in which your plan survived. Note this is a different measure than the Monte Carlo success rate: it’s historical frequency, not simulated probability. "90%" here means your plan failed in about 9 of 98 real sequences.
- Worst start year — the historical period that treated your plan worst (often one that led into a major bear market early in retirement, like 1966 or 2000).
- Best start year — the most favorable sequence.
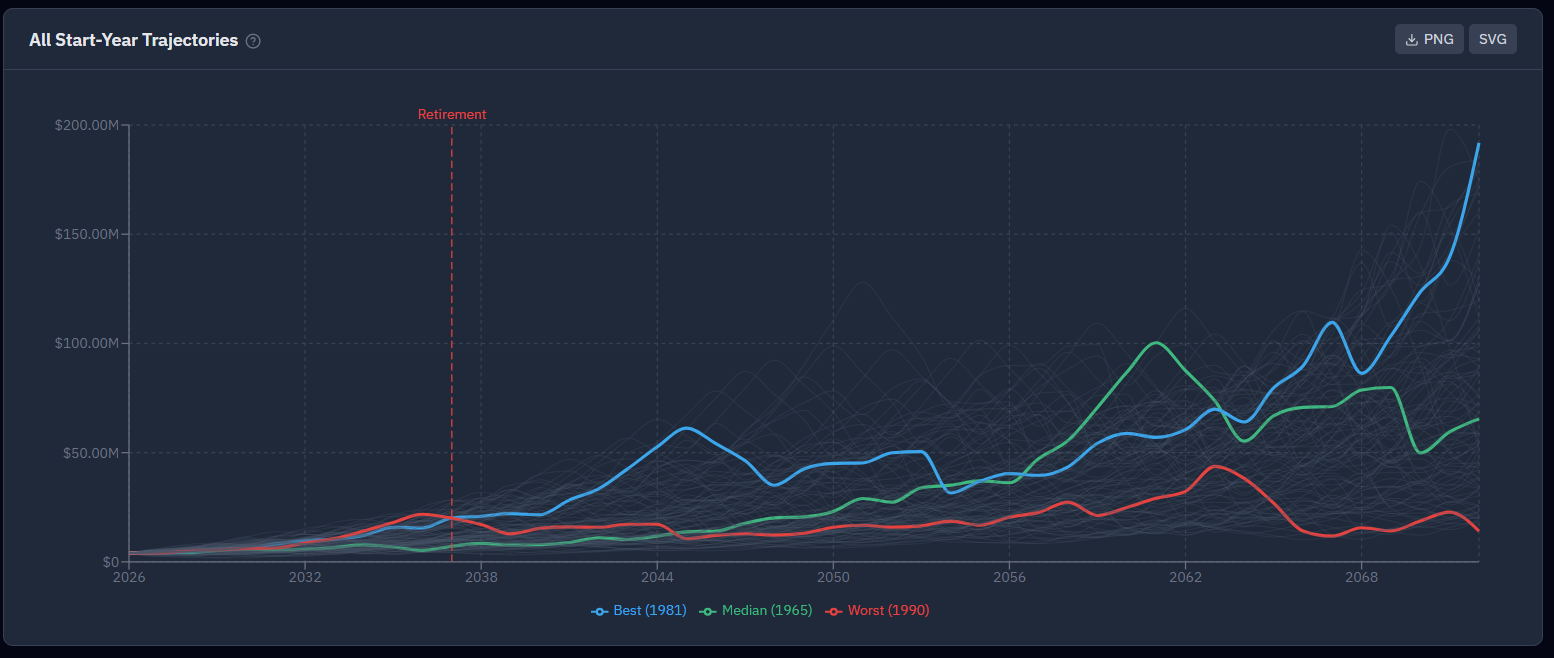
- Trajectory chart — all 98 historical paths overlaid, with the worst, best, and median highlighted. Hovering the chart lists every start year at that point, including plans that ran out of money, which appear at $0.
Important caveats
- Only 98 data points. That’s far fewer than a 5,000-run Monte Carlo, so the statistical confidence is lower. Read it as illustrative history, not precise probability.
- U.S. large-cap and Treasuries only. International stocks, small caps, real estate, and alternatives aren’t in the historical series.
- Long horizons wrap around. If your plan runs longer than 98 years, late start years loop back to 1928 to finish; those synthetic sequences are flagged.
- The past isn’t a forecast. The next 30–40 years may look nothing like any sequence on record. Like the Results and Compare tabs, this tab carries a modeling-and-assumptions disclaimer banner at the top — a standing reminder that these are educational estimates, not predictions.
How it fits with everything else
Think of three complementary lenses on market risk:
- Monte Carlo (the main simulator) — thousands of randomized futures from your assumptions.
- Block bootstrap (on the Assumptions tab, and the default mode) — many futures stitched from blocks of real history.
- Historical backtest (this tab) — each real start year replayed exactly.
A natural workflow: run Monte Carlo for the broad picture, then use the backtest (and the bad-sequence overlay on the Results tab, which drops the worst real starting points onto your trajectory chart) to sanity-check it against history. If your plan survives the genuinely bad real sequences — 1929, 1966, 2000 — that’s meaningful reassurance. See what if returns disappoint? and Understanding your results.