
Assumptions Tab
The Assumptions tab is where you set how markets and inflation behave in your simulation. The defaults are based on long-term historical averages and are a sensible starting point — but this is also where you go to stress-test a more cautious future. Every value is editable.
Expected return and volatility
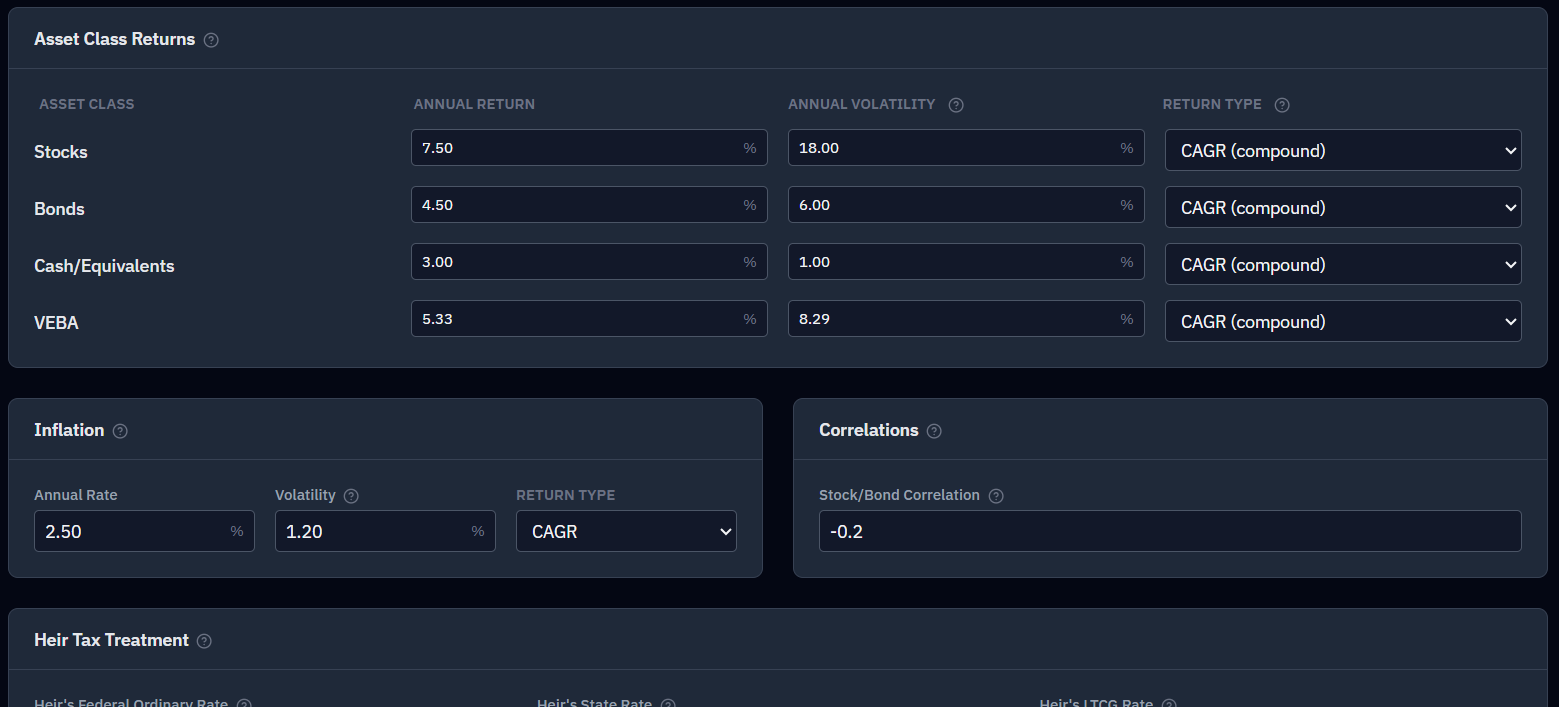
Each asset class has two inputs:
- Expected annual return — the average return you assume it earns over the long run.
- Annual volatility — how much returns swing from year to year. Higher volatility means a wider range of outcomes (both better and worse), which widens the bands in your results.
These two inputs drive the simulation only in Stochastic (Parametric) mode. New scenarios default to Block Bootstrap, which samples returns from real market history instead — see Return generation mode below.
Default assumptions — grounded in long-run market history, set on the conservative side rather than matching the rosiest historical averages:
| Asset class | Expected return | Volatility |
|---|---|---|
| Stocks | 7.5% | 18.0% |
| Bonds | 4.5% | 6.0% |
| Cash / money market | 3.0% | 1.0% |
| VEBA | 5.33% | 8.29% |
| Inflation | 2.7% | 1.2% |
Lower the return numbers if you want a more conservative plan — see what if returns disappoint?
Return type: CAGR vs. arithmetic mean
This setting decides how your return number is interpreted, and it matters more than people expect:
- CAGR (Compound Annual Growth Rate) — the geometric average: the return you actually experience as money compounds over time. It accounts for the drag of volatility (a 50% gain then a 50% loss leaves you down, not even). This is the default, and the right choice for most planning.
- Arithmetic mean — the simple average of yearly returns. For a volatile asset it’s higher than the CAGR, so using it produces more optimistic projections.
The gap between the two grows with volatility. Most published return figures are arithmetic means; CAGR is closer to what a long-term retiree actually lives. When in doubt, leave this on CAGR.
Stock–bond correlation
By default, stocks and bonds have a slight negative correlation (−0.20) — meaning when stocks fall, bonds tend to hold up or rise. This is why holding some bonds reduces overall portfolio risk, and RetireRange draws the two together so that relationship is reflected in every simulated path. Adjust it if you believe the relationship will differ. (Note: the model holds this correlation constant; in real crises, assets can become more correlated — see Limitations.)
Inflation
- General inflation (default 2.7%, with its own volatility) drives the rising cost of everything and the inflation-adjustment of your spending and benefits.
- Medical inflation — off by default (medical costs rise with general inflation). Turn on Use separate medical inflation to set a higher healthcare rate; it starts at 5% — a historically informed figure, since medical costs have tended to rise faster than general prices — and medical expenses then grow at that rate instead.
- Social Security COLA — by default your benefit grows with general inflation; you can set a separate cost-of-living rate if you want to model SS keeping more or less pace.
With either separate rate turned on, a blank rate, a rate at or below −100%, or a blank or negative volatility shows a red error on that field and blocks the run. If the medical rate is below general inflation, a warning appears on the medical Annual Rate field.
Heir tax treatment
Used only for the after-tax legacy figure — what your heirs actually keep after the tax due on what they inherit. The IRS treats inherited accounts very differently by type, so the Heir Tax Treatment card has three inputs:
- Heir’s Federal Ordinary Rate (default 25%) — applied to inherited Traditional (401(k)/IRA) and HSA balances, which a non-spouse heir takes as ordinary income.
- Heir’s State Rate (default 0%) — added on top for those same Traditional/HSA balances. Use your heirs’ likely state marginal rate (~5% CT, ~6.5% NY); leave 0% for no-income-tax states (FL, TX, TN…).
- Heir’s LTCG Rate (default 15%) — the long-term capital-gains rate for inherited Taxable accounts, whose basis steps up at death so only post-death growth is taxed.
Roth and VEBA pass to heirs at full value — no tax is applied to either.
Each rate must be between 0% and 100%, and the federal and state rates together cannot exceed 100% (a hard error otherwise). You get a warning if the combined rate is above about 50%, or if it is exactly 0%, because at 0% the after-tax legacy figure stops distinguishing between strategies. Percentage fields display the exact stored value (4.125% stays 4.125%), so editing a field never rounds it.
Return generation mode (how each future is built)
The Return Generation Mode card decides how the engine produces the returns behind every simulated future. There are two modes:
- Block Bootstrap (Historical resampling) — the default for new scenarios. Each simulation is stitched together from random blocks of consecutive years of real market history (1928–2025), sampled with replacement. It preserves the structure a bell curve misses — momentum, volatility clustering, inflation regimes, and the fat tails of genuine crashes. The Block Length (default 5 years; a whole number of at least 1) controls how much of that structure survives: shorter blocks reshuffle history more aggressively, longer blocks keep regime runs intact.
- Stochastic (Parametric) — the alternative. Each month is drawn from the normal distributions configured above: per-asset-class expected return and volatility, the stock–bond correlation, and inflation. It’s cleaner and gives more independent draws, but it understates how often bad years arrive in clusters.
Bootstrap is the default because in retirement, sequence matters as much as average: a bad decade early in retirement is what breaks a plan, and real history contains those decades in the order they actually happened.
Which inputs each mode reads — this is the part that surprises people. In Block Bootstrap mode the expected return, volatility, stock–bond correlation, and general inflation inputs above are not used; those numbers come from the sampled historical years instead. They apply in Stochastic mode. What still applies in both modes: VEBA growth, a separate medical inflation rate, and a separate Social Security COLA (and the CAGR vs. arithmetic setting, which governs how those three are read). So to stress-test with lower returns, switch to Stochastic mode first — see what if returns disappoint?.
Block bootstrap is a close cousin of the Historical backtest — bootstrap reshuffles history into many paths, while the backtest replays each historical start year exactly.
Already have saved scenarios? They keep the mode they were saved with. A scenario saved before this change that never set a mode still runs in Stochastic — only brand-new scenarios pick up the Block Bootstrap default.
Getting back to the defaults
Experimented your way somewhere you’d rather not be? The Reset to Defaults button at the top-right of the tab clears your assumption edits and restores the shipped defaults in one click — the return models, inflation, stock/bond correlation, heir-tax rates, the separate-medical-inflation and separate-SS-COLA toggles, and the return-generation mode. It asks you to confirm first (an inline "Clear your assumption edits and restore the defaults?" prompt), so there’s no risk of an accidental wipe. Contribution limits are not affected — those are IRS-published reference figures, maintained separately.
A good way to work
Start with the defaults, get a baseline, then change one assumption at a time and re-run so you can see its effect. The Assumptions tab is the natural home for stress-testing — trim returns, raise inflation, or switch return generation mode and compare. For what the results mean, see Understanding your results; unfamiliar terms are in the Glossary.