
Features
Most retirement calculators are a single input box and a single answer. RetireRange is a complete modeling environment — the kind of analysis a planner runs, with every input in your hands. Below is what’s inside. (For how it stacks up against free calculators, advisors, and other paid tools, see Why RetireRange.)
The simulation engine
Thousands of futures, not one projection.
RetireRange runs 5,000 independent simulations by default (configurable up to 10,000 for close calls). Each one generates its own month-by-month sequence of stock, bond, cash, and inflation returns across your full plan horizon — so you see how your plan holds up across thousands of plausible futures, not one tidy average.
- Correlated returns. Stocks, bonds, cash, and inflation are drawn together using their real-world relationships, not as independent coin flips.
- Sequence-of-returns risk, captured. The order your returns arrive in is modeled explicitly — a crash early in retirement does damage a late one never would. A single-number calculator can’t see this. It’s the reason that financial planners tend to use Monte Carlo analyses.
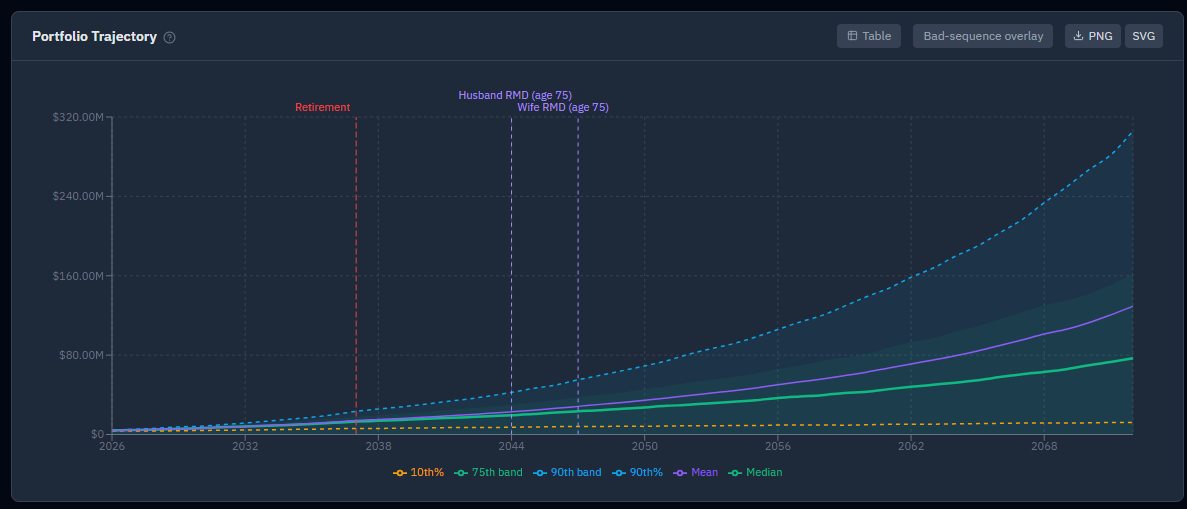
- What you get back: your success rate, your shortfall rate, and the full spread of ending outcomes from P10 (bad luck) to P90 (good luck).
Build and Compare Strategies
Save named strategies. Compare them on equal footing.
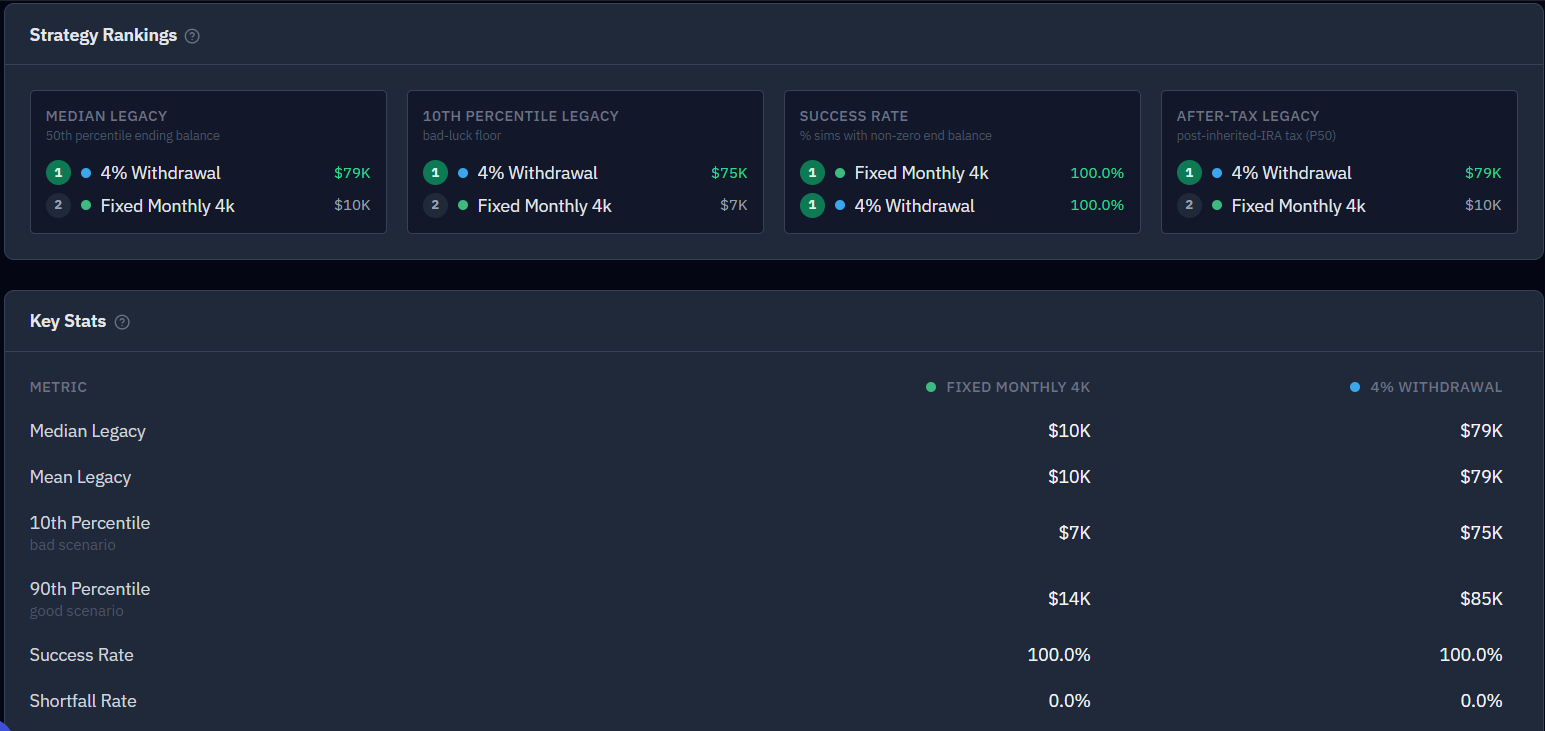
Set up a strategy — withdrawal method, spending target, account allocation, Social Security ages, conversions — name it, and save it. Then build another. The Compare tab runs your finalists against the same random market sequences, so any difference in outcome reflects the strategy itself, not who got luckier. The Optimizer works the same way: every candidate in a search is scored against identical markets, so a ranking reflects strategy quality rather than which plan drew kinder dice.
Withdrawal methods:
- Classic — a fixed amount, inflation-adjusted each year. Stable, predictable.
- Dynamic — recalculated from your portfolio value each month. Spending flexes with the market.
- Guardrails — fixed spending with automatic cuts or raises when your withdrawal rate drifts too far from target.
Plus the levers that actually shape a plan:
- Spending phases — model the "go-go / slow-go / no-go" reality that spending isn’t flat across retirement.
- Account allocation and cascade — control which account types you draw from and in what order; when one is exhausted, withdrawals cascade automatically.
- Downturn rules — optionally pull back on equity withdrawals during a market drop and refill a cash reserve as it recovers.
- Rebalancing — optionally steer the portfolio back to a target mix each year, so the plan doesn’t quietly drift into a far riskier portfolio than you chose. Rebalancing inside a brokerage account is taxed, like the real thing.
- Lump-sum events — one-off inflows or outflows (a home sale, a big purchase) at the year you choose.
The Optimizer
Stop guessing and checking. Let it search.
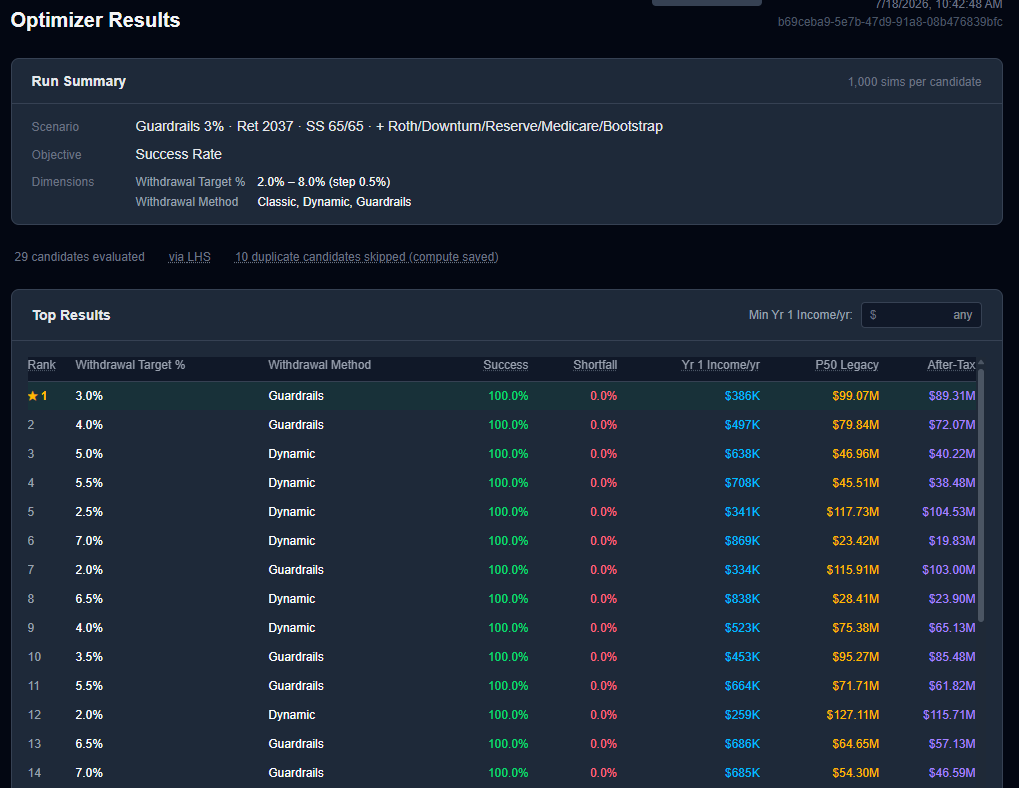
Hand the Optimizer a decision and a range, and it sweeps the whole space for you — running simulations across every candidate and plotting how your metrics respond. It can search across claiming ages, withdrawal rates and methods, guardrail bounds, account allocation, Roth conversion amounts, downturn thresholds, cash-reserve size, and even where and when to relocate for state-tax savings.
- Efficient by design — a coarse pass finds the promising region, then a fine pass zooms in.
- Runs in the background — submit a job and keep working; results can be emailed to you when the run finishes.
- Set outcome floors — "success rate at least 90%", "median legacy at least $1M". Candidates that miss are shown greyed out rather than hidden, so "nothing met your floor" never gets mistaken for "the search found nothing."
Social Security
Claiming age is a six-figure decision. Treat it like one.
Enter your benefit estimates, or import them. Type the monthly amounts straight off your SSA statement — there are fields for age 62, your full retirement age, and age 70, in today’s dollars. If you’d rather not retype them, download the statement data XML from your my Social Security account and RetireRange reads the same estimates straight out of it — parsed in your browser, never uploaded. It can also recompute your benefit from your actual earnings history under a stop-working age you choose, which matters because SSA’s own figures assume you keep earning right up until you claim. For anyone retiring early, that assumption quietly inflates the number every other calculator takes at face value.
From there, RetireRange interpolates every age between 62, FRA, and 70 using standard SSA adjustment factors. Test claiming strategies head-to-head, or let the Optimizer find the age that maxes out your success rate.
- Survivor benefits are modeled when one spouse dies — the survivor’s benefit steps up to the larger of the two, which is why the higher earner’s claiming age matters so much.
- Spousal benefits follow SSA’s actual rules — no spousal payment until the worker spouse has filed, and the early-claiming reduction set by your age when the benefit begins rather than when you claimed your own. For couples where one delays and one doesn’t, that changes the answer.
Taxes, RMDs, and Roth conversions
Model the tax decisions that play out over decades.
- Required Minimum Distributions — calculated on the IRS Uniform Lifetime Table, pooled per person and account type the way the IRS permits, spread evenly across the year, and forced automatically if your voluntary withdrawals fall short.
- Roth conversions — schedule annual Traditional→Roth conversions over a year range and see the trade-off: more tax now vs. a lighter RMD burden (and lighter heir taxes) later. Conversions are booked as ordinary income in the conversion year.
- Federal tax — brackets and the standard deduction are modeled and inflated forward with simulated inflation.
- State tax for all 50 states + DC. Choose your state of residence and the model applies that state’s brackets and standard deduction — including the states with no income tax — and applies each state’s Social Security tax treatment. You can also model a planned mid-retirement move from one state to another — see the tax impact of relocating, compare states, and even let the Optimizer search for the best year to move for maximum tax savings.
Healthcare and Medicare
The gap most tools gloss over — the years before Medicare.
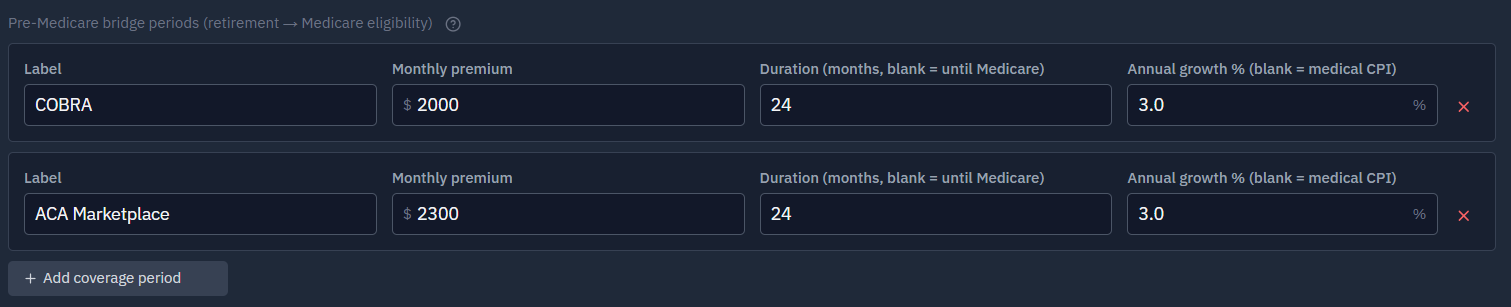
- Pre-Medicare bridge — model the gap between retiring and Medicare as a chain of up to five coverage periods (e.g., COBRA → ACA marketplace), each with its own monthly premium and growth rate, per person, running until Medicare eligibility.
- Medicare premiums — optionally add CMS Part B and Part D base premiums automatically starting at 65, plus a per-person Medigap supplement.
- Medical accounts done right — medical costs draw from your VEBA (Voluntary Employee Benefit Account), then HSA, then overflow into your general pool. VEBA — and, by default, HSA — stays reserved for healthcare rather than raided for lifestyle spending, though you can opt to treat an HSA as tax-free general savings instead.
- HSA "stealth IRA" mode — optionally let your HSA grow tax-free and defer using it until a chosen age, leaning on the IRS unlimited-lookback reimbursement rule.
- IRMAA awareness — the model tracks the income-based Medicare premium surcharges a high-income year can trigger.
Surviving spouse and mortality
Model what happens when one partner outlives the other.
Most households never run this — and it’s one of the biggest financial shifts in retirement. RetireRange offers three mortality modes:
- None — no death modeled.
- Deterministic — death fires at an exact age every run. Best for clean strategy comparisons.
- Stochastic — each simulation draws a death age from the SSA 2021 Period Life Table, showing the full distribution of survivor outcomes.
When a death occurs, the model handles the real consequences: filing status flips to Single (often raising taxes), accounts transfer to the survivor, Social Security recalculates, and future RMDs use the survivor’s age.
Historical backtest
How would your plan have survived the markets that actually happened?
Beyond simulated futures, replay your exact strategy against every market sequence from 1928 to 2025 — 98 real start years — using actual S&P 500, Treasury, T-bill, and CPI returns. See your historical success rate, your best and worst starting years (the usual worst cases: 1929, 1966, 2000), and all 98 trajectories overlaid.
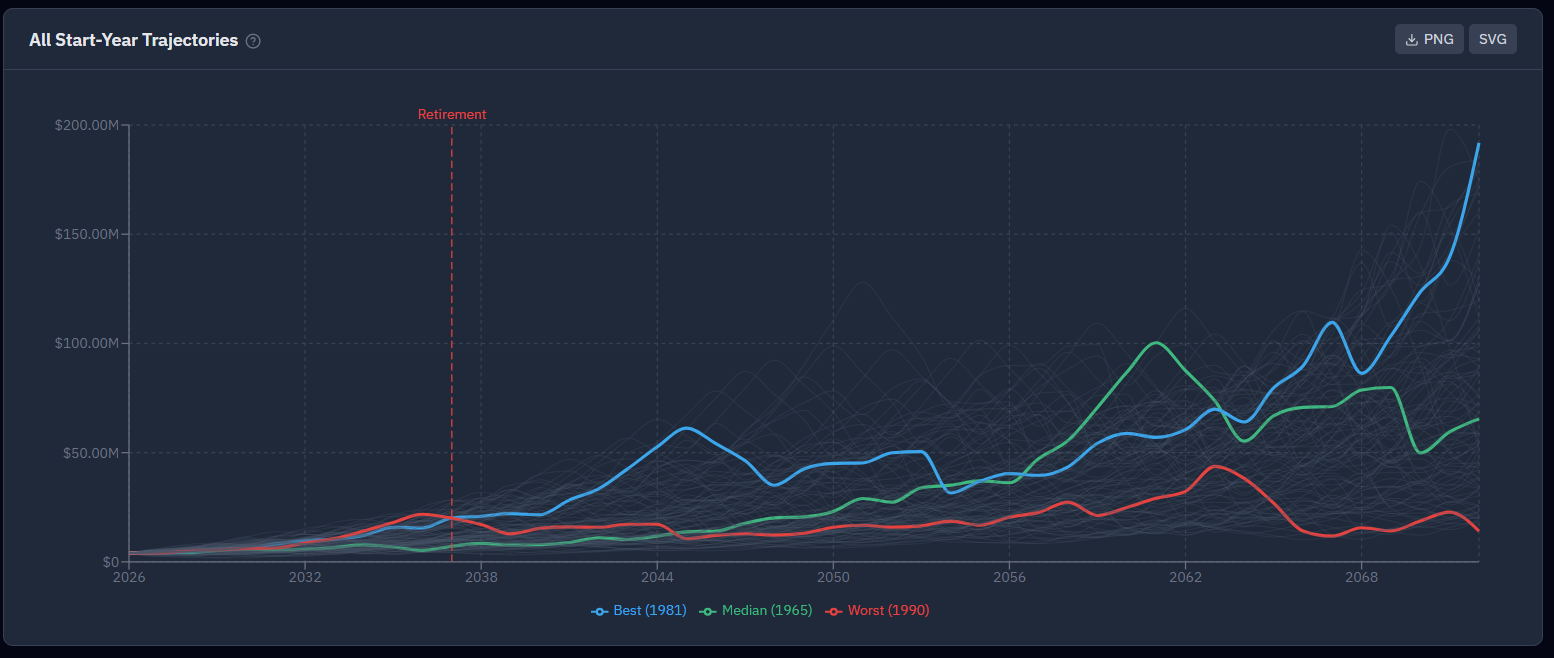
It’s the perfect cross-check on the Monte Carlo results: simulated ranges and real history, answering the same question two different ways.
Reading your results
Numbers you can act on — and a plain-English read on what they mean.
- Success Rate — the headline: how often your plan survived to the end.
- Shortfall Rate — how often you’d have had to cut spending below target, even briefly.
- Outcome range over time — a shaded band showing how your savings could grow or shrink year by year, from the unlucky cases at the bottom edge to the fortunate ones at the top, with the most likely path down the middle.
- After-Tax Legacy — what your heirs actually keep after taxes on inherited accounts.
- Income, tax, RMD, and ruin-probability charts, an ending-balance distribution, and a per-account stack showing your draw-down order.
- Nominal or real dollars — toggle to see whether your income is holding its purchasing power.
Get it in plain English — powered by Anthropic’s Claude.
One click turns that screen of percentiles into a plain-language summary — where your plan looks strong, where the real risks sit, and which strategies are worth exploring next. It’s the difference between seeing your results and knowing what to do with them: which lever to test next, which assumption to stress, which question to take to your advisor.
A plan you live with
Update it as life actually unfolds.
Your plan isn’t a one-time verdict. Whenever you want — quarterly, annually, after a big change — update your account balances and any assumptions that have shifted, then re-run. There’s no automatic tracking and nothing to sync: you decide when and what to update. RetireRange flags any saved scenario whose numbers predate your latest update, so you always know which results still reflect reality. The check-in routine walks through exactly what to review, and how often.
Built to be usable
Form fields are labelled for screen readers, help tooltips and account cards work from the keyboard, and pop-up dialogs trap focus and close with Escape.
Reference data, built in
Current federal and state tax brackets, IRMAA tiers, and RMD tables are included and viewable in the app, so you can see the actual numbers behind your results — and they’re refreshed as the IRS publishes new figures.
Want to look deeper first?
Not ready to jump in? These walk through the why, not just the what:
- Why RetireRange — how it compares to free calculators, advisors, and other paid tools.
- How it works — a narrative walkthrough, from your first input to reading the results.
- What is this? — the plain-language overview, if you’re still getting oriented.
- How to answer your retirement questions — a map from the question you’re actually asking to the fastest way to answer it.
- The Planner’s Guide — the full methodology and assumptions, detailed enough to share with a financial planner.
- FAQ and Pricing — the practical questions.
Pricing
Everything on this page is included in one plan — $20/month, or $200/year (two months free). No tiers, no add-ons. We don’t connect to your bank, hold your money, or sell your data. Full detail on the pricing page.